Correlation of Damages
Regression Equation
Relationship of Awards
Scatterplots
In exploring the relation between two reasonably well-behaved quantitative variables, much of what is useful about correlation and regression can be observed visually through the use of scatterplots.
Figure 2 contains
four scatterplots.
The plot in “a” illustrates a perfect positive linear correlation. All data points fit on an upward-sloping straight line.
The plot in “b” illustrates a perfect negative linear correlation. All data points fit on a straight line, but this line slopes downward.
A correlation coefficient measures the degree of association, denoted
in the figure by r.  This
measure of correlation is often called Pearson's correlation coefficient,
after its originator. In a perfect linear correlation, the correlation
coefficient, r, is +1 for a positive correlation and -1 for a negative
correlation.
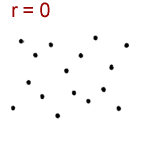
In plot “c”, the eye detects no correlation. 
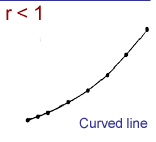
And in plot “d” a correlation exists, but it is not linear.

